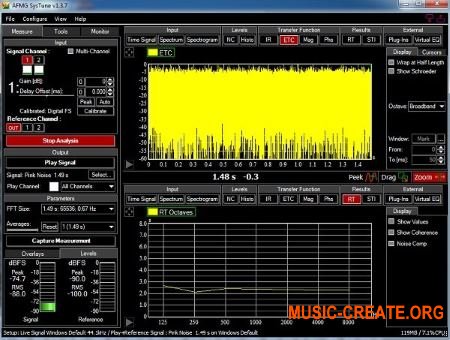
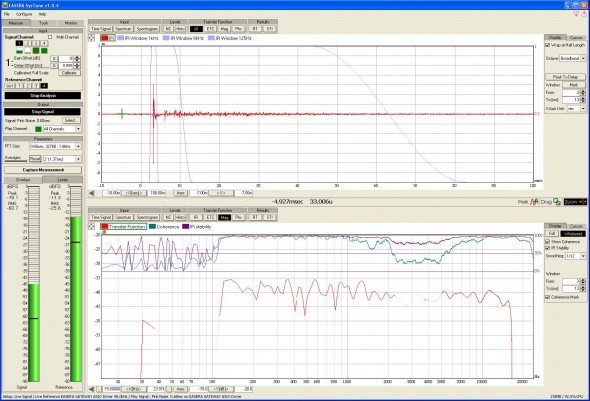
AFMG EASERA SysTune Pro является программным комплексом для измерения акустических параметров помещения в реальном масштабе времени на шумовых и музыкальных сигналах. Поскольку импульсный отклик содержит все данные, описывающие акустическое поведение системы и комнаты, полноразмерный импульсный отклик имманентен для надежных измерений, предоставляющих достоверные данные.
Next to the sole quality of the measurements performed SysTune offers a large set of unique features to make a technician’s life easy and speed up the work. All assets taken together, SysTune can surely be called the most progressive and professional audio measurement tool available.
— Patented RTD algorithm for real time measurement of full-length impulse responses
— Virtual EQ to simulate effects of tuning without the need for ongoing measurements or influencing the live signal
— Unique Delay Analysis module for fast and precise optimization of loudspeaker delay times
— Universal Web Interface for remote control of measurements from smartphones and tablets
— Integration with DSPs, controllers and other hardware like Lake Controllers and many others
— Unmatched noise immunity thanks to the patented SSA filter
— Numerous further functions for better windowing and higher bass resolution.
О, нет
ссылка на загрузку не доступна
Лицензия:
Условно-бесплатная $850
Количество загрузок:141
Операционная система:Windows XP/Vista/7/8/10/11
Последняя версия:1.2
Сообщить о неточности
Описание

Cкриншот
EASERA 1.2 доступна для бесплатной загрузки с нашей библиотеки. Наш встроенный антивирус проверил эту закачку и признал ее как 100% безопасную.
Самые популярные версии среди пользователей EASERA 1.2, 1.1 и 1.0.
Наиболее часто используемые названия файлов для установки этого программного обеспечения: EASERA SysTune.exe, EASERA.exe и PEasera.exe и т.д. ПО принадлежит к категории Образование, а точнее к подкатегории Наука.
От разработчика:
EASERA stands for Electronic and Acoustic System Evaluation and Response Analysis and is a great solution for electronic and acoustic analysis with industry standard quality and incredible flexibility and power.
The program consists of four logical parts: signal generator, measurement, real time analyser and post processing.
Мы предлагаем оценить другие программы, такие как EASERA SysTune, Real Time Analyzer или Real Time Design, которые часто используются вместе с EASERA.
Обновлено:
11 янв., 2023
Charlie gives an overview and capabilities of Easera Systune.
EASERA SysTune™ is a relatively new, patent pending audio measurement program from the Ahnert Feistel Media Group (AFMG). It is designed for real-time analysis of acoustic signals and aimed at those doing system alignment, tuning and live sound applications. SysTune is not a replacement or upgrade for the EASERA measurement program. Rather, it has its own unique features that allow it to perform measurement tasks not currently available in other measurement programs. More in-depth acoustical analysis of the measurements made with SysTune can be done with EASERA. SysTune runs under Windows 2000, XP and Vista operating systems. It is a multi-threaded application that is capable of taking advantage of multiple processors within a computer.
SysTune supports up to 8 input channels simultaneously at up to 192 kHz sample rate. It can operate in a dual-channel FFT mode, meaning that one input channel receives a reference signal (mixing console output for example) to which the other input channels are compared. SysTune can also output its own signal (sweeps, pink noise or user selected files) and use this as the reference. Switching between each of the input channels is accomplished easily by clicking on its channel button. These are located just above the mini-meter for each channel. The mini-meters are very convenient to tell at a glance which channels are receiving good signal level. If an overload (clip) of the A/D converter occurs the meter turns red. After the overload passes the outline of the mini-meter stays red until it is reset.
There is a multi-channel mode which allows two or more inputs to be averaged in real-time and the result displayed. This feature can be very useful to spatially average the sound system response using multiple microphones in different locations.
There is a very important and novel process at work under the hood of SysTune. This is the Real-Time Deconvolution (RTD™) engine. This newly developed algorithm allows for the calculation and display of impulse response (IR) data of up to 10 seconds in real-time and with fast on-screen display refresh rates. To accomplish this SysTune performs an FFT on the signals from the input channel and the reference channel. The transfer function (TF) of the input channel is then calculated in the frequency domain by complex division of these spectra. Finally, an inverse FFT is performed on the transfer function to yield the IR.
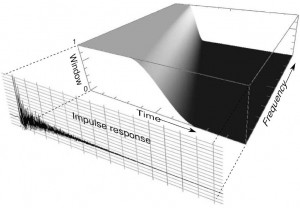
Figure 1- Time-Frequency-Constant Window
Another unique feature in SysTune is one of the windowing options. While some standard window functions are available (Rectangular, Tukey 50%, Hann and Blackman) a new Time-Frequency-Constant (TFC™) window function has been developed by AFMG. This is not a fixed length window, as are the others. The time length of the TFC window changes as a function of frequency. The window time is inversely proportional to frequency so that multiplying the window time at a given frequency by that frequency yields a constant value. As an example, if the window time length is set to 10 ms this is the length for 1 kHz. At 8 kHz the window is 1.25 ms, while at 125 Hz it is 80 ms (see Figure 4). This allows reflections to be excluded from the measurement at higher frequencies. At lower frequencies the window is longer so frequency resolution is increased, on a fixed bandwidth basis. This can also be thought of as having a constant percentage octave frequency resolution across the entire frequency spectrum. A three-dimensional representation of the TCF window is shown in Figure 1.
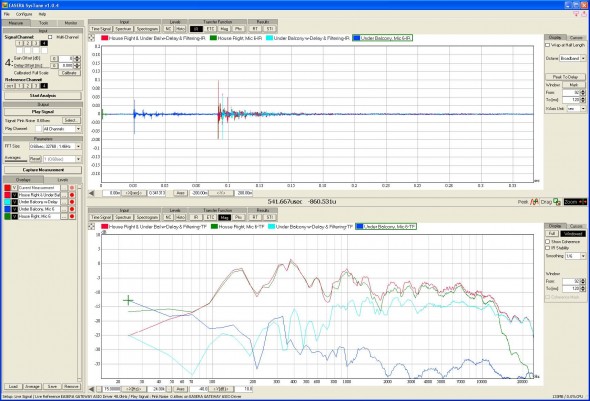
Figure 2 – Alignment of under-balcony loudspeaker
One of the most useful aspects of SysTune is the way in which the measurement data can be displayed for the user. There is an upper and lower display graph, either of which can be maximized to fill the entire display if desired. Any of the possible display selections can be shown in either graph area to suit the user’s preference. The ability to view measurement data in both the time and frequency domains simultaneously can be of great benefit. Figure 2 shows captured measurements made during the alignment of an under balcony loudspeaker to one of the main clusters in a large church. The upper graph shows the IRs while the lower graph shows the transfer functions for a microphone position in the under balcony area. The green and blue curves are the main house right cluster and the initial measurement of the under balcony loudspeaker, respectively. The signal from the under balcony loudspeaker precedes that of the main cluster by approximately 65 ms at this mic position. The cyan curve shows the result of applying 70 ms of delay and some filtering to the under balcony loudspeaker. SysTune allowed the delay and EQ to be set relatively quickly while listening to the results to confirm a natural sonic character with the focus of origin at the main house cluster and not at the under balcony loudspeaker.
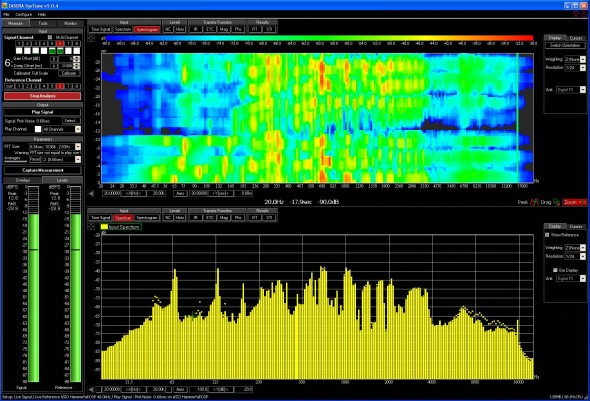
Figure 3 – The spectrogram display allows either the vertical or horizontal axis to display frequency.
It is also possible to display the spectrum or spectrogram of the input signal. The spectrogram can be particularly useful during a live performance to help pin point feedback frequencies. Most of the programs I have seen display the spectrogram with time on the horizontal axis and frequency on the vertical axis. SysTune does this as well. However, it also allows for the axes orientation to be switched. This places frequency on the horizontal axis to coincide with display of most other frequency vs. magnitude graphs (Figure 3).
SysTune also includes some handy ways to help determine if the displayed measurement data can be trusted or if it should be considered suspect. It does this in two different ways; Coherence and IR Stability. The coherence function is similar to other programs such as Smaart® and SIM®. This is a measure of the correlation between the input signal and the reference signal. When the coherence value falls below the user defined threshold, the Coherence Mask can be used to make the measurement data in this same frequency region somewhat transparent. This can be seen in Figure 4 below 100 Hz and from 2 – 5 kHz where the coherence value is below 35%. Hand claps were used to contaminate the measurement in the higher frequency region.
Figure 4 – IR and TF of small loudspeaker using TFC window. Upper Graph – Measurement (red), TFC windows 1kHz, 8kHz & 125 Hz (light purple). Lower Graph – Measurement (red), Coherence (bluish-green), IR Stability (dark purple).
IR Stability is also a correlation of the input and output of the system under test. However, it does not directly relate the input to the output as coherence does. Instead it is a differential function that quantifies the similarity of the last two measurements. It is also given as a percentage from 0% to 100% as is coherence. Because IR Stability only looks at the most recent two FFT measurement blocks it can give a fast indication of changes in the data which occur very quickly.
Since SysTune calculates an IR in real-time, it can also calculate a couple of metrics in real-time which are derived from the IR; Reverb Time (RT) and Speech Transmission Index (STI). STI is a measure of how well a system under test transmits human speech so that it can be intelligible to a listener. SysTune will display either RT or MTI (Modulation Transfer Index) and STI as measured in real-time. It will display a curve and give the values at one octave data point intervals from 125 Hz to 8 kHz. A broadband value for STI is also given. It should be noted that while SysTune implements the calculation of STI per the IEC 60268-16 standard, it does not include correction factors for signal masking and noise levels. This can be done, however, by saving a measurement in SysTune and opening it in EASERA for more detailed analysis.
The capability of performing IR measurements in real-time can be used in concert with the dual-channel FFT mode to measure the IR, RT and STI of a venue with a full audience present, but without the use of sweeps or noise test stimuli. This can even be done for a purely acoustical performance without the use of a sound reinforcement system! An actor or soloist may be fitted with a microphone to capture their performance at a relatively close distance. This will serve as the reference signal in SysTune. Several measurement microphones may be placed in the room. SysTune can then perform all of the measurements of which it is capable. One potential deficiency with this method is that the source for the reference signal (actor/soloist) may not sufficiently excite the system under test at all frequencies of interest. This will result in low coherence values at these frequencies.
SysTune is also capable of measuring, displaying and saving SPL and Leq histograms. Weighting functions (A, B and C) can be applied to the SPL measurements. These can have a Slow (1 s), Fast (125 ms) or Impulse (35 ms) time constant applied during the measurement. The averaging time for Leq can be set by the user. This capability can be useful for doing noise studies over extended periods of time. Noise Criteria (NC) can also be calculated and displayed from a measurement of the ambient noise present.
We have briefly touched on some of the more common functions and uses for EASERA SysTune. There are many more features to this piece of software that can make it a valuable tool to the electro-acoustical practitioner. A free demo version of the program can be downloaded from www.easerasystune.com/. ch
SysTune takes accurate acoustical measurements in real time
Download the latest version from the developer’s website
Scanned by 75 antivirus programs on Jun 27, 2023.
The file is clean, see the report.
Version: 1.3.7.492 (x86)
Date update: Oct 7, 2021
File name: EASERASysTuneDemoSetup.zip
Size: 19.4 MB
Additional links
Purchase at afmg.eu for
$787.50
Latest versions of EASERA SysTune
Oct 7, 2021
EASERASysTuneDemoSetup.zip
Feb 8, 2012
easerasystunedemosetup.zip
Alternative software

Auto-Tune EFX VST
Auto-Tune EFX 2 is the easiest-to-use tool for real-time pitch correction.
Q-Sys Designer
Free
Build applications for the Q-SYS audio, video, and controller devices.
V.R | 24.3.2017 | 14.7 MB
Live Sound Measurements In Real Time!
Based on AFMG’s patented RTD algorithm SysTune is the only audio measurement software capable of measuring and processing full-length impulse responses in real time. Since the impulse response contains all data describing the system’s and the room’s acoustical behavior, a full-length impulse response is immanent for reliable measurements providing valid data.
Next to the sole quality of the measurements performed SysTune offers a large set of unique features to make a technician’s life easy and speed up the work. All assets taken together, SysTune can surely be called the most progressive and professional audio measurement tool available.
— Patented RTD algorithm for real time measurement of full-length impulse responses
— Virtual EQ to simulate effects of tuning without the need for ongoing measurements or influencing the live signal
— Unique Delay Analysis module for fast and precise optimization of loudspeaker delay times
— Universal Web Interface for remote control of measurements from smartphones and tablets
— Integration with DSPs, controllers and other hardware like Lake Controllers and many others
— Unmatched noise immunity thanks to the patented SSA filter
— Numerous further functions for better windowing and higher bass resolution

