- Информация о материале
- Обновлено: 05.04.2023, 13:29
- Опубликовано: 05.04.2023, 13:26
- Автор: DeniS
6. Руководство по эксплуатации (для осциллографа)
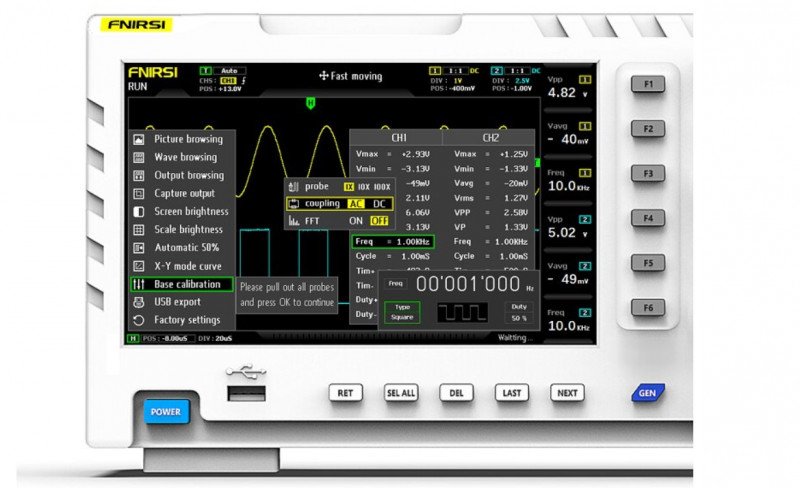
Включить или отключить Канал 1 / Канал 2: нажмите кнопку [CH1] / [CH2], чтобы выбрать Канал 1 / Канал 2. Для того, чтобы включить быстрое преобразование Фурье (БПФ), нажмите одну из двух кнопок [CONF], которые находятся снизу от кнопок CH1 и CH2 соответственно, откроется меню параметров Канала 1 / Канала 2, затем выберите и включите / выключите БПФ с помощью клавиш навигации.
Выбрать тип тока на входе: нажмите кнопку [CONF], которая находится снизу от кнопки CH1 либо CH2, откроется меню параметров Канала 1 / Канала 2, затем выберите DC / AC (постоянный / переменный ток) с помощью клавиш навигации. Установить коэффициент входного сигнала датчика: нажмите кнопку [CONF], которая находится снизу от кнопки CH1 либо CH2, откроется меню параметров Канала 1 / Канала 2, затем выберите необходимую опцию из 1x / 10x / 100x с помощью клавиш навигации.
Масштабирование формы сигнала: на передней панели прибора найдите кнопки, сгруппированные в блок с названием VERTICAL. Для управления вертикальной настройкой поверните энкодер с обозначениями + и — в левом, либо в правом нижнем углу блока (для Канала 1 и Канала 2 соответственно). Для управления горизонтальной настройкой Канала 1 и Канала 2, поворачивайте крупный энкодер, находящуийся снизу от блока VERTICAL. Поворот по часовой стрелке увеличивает масштаб, поворот против часовой стрелки — уменьшает.
Смещение сигнала: для перемещения сигнала Канала 1 или Канала 2 по вертикали, поверните небольшой энкодер с надписью Position в левом верхнем или правом верхнем углу блока VERTICAL соответственно. Для смещения вверх вращайте энкодер по часовой стрелке, для смещения вниз — против часовой стрелки. Для перемещения сигнала Канала 1 или Канала 2 по горизонтали, поверните небольшой энкодер с надписью Position, которая находится в блоке кнопок горизонтальной развертки HORIZONTAL, справа от блока VERTICAL. Поворот по часовой стрелке — смещение вправо, поворот против часовой стрелки — смещение влево. В ходе регулировки положения можно нажать кнопку [SLOW] для выбора грубой или точной регулировки.
Регулировка напряжения: найдите блок кнопок с надписью TRIGGER. Поверните небольшой энкодер с надписью Level, чтобы отрегулировать триггерное напряжение. В ходе регулировки можно нажать кнопку [SLOW] для выбора грубой или точной регулировки. Обратите внимание: перед тем, как начать регулировку, сперва отключите автоматический триггер 50%, в противном случае, отрегулировать напряжение триггера будет нельзя.
Установка фронта триггера: нажмите кнопку EDGE, чтобы выбрать восходящий / нисходящий фронт.
Установить автоматический триггер: нажмите кнопку MODE для переключения между автоматическим / однократным / нормальным режимом триггера, выберите Auto (автоматический режим триггера).
Установить одиночный триггер: нажмите кнопку MODE для переключения между автоматическим / однократным / нормальным режимом триггера, выберите Single (однократный режим триггера).
Установить нормальный триггер: нажмите кнопку MODE для переключения между автоматическим / однократным / нормальным режимом триггера, выберите Normal (нормальный режим триггера).
Пауза / запуск: нажмите красную кнопку [RUN / STOP] в правом верхнем углу передней панели для запуска или остановки работы прибора.
Автоматическая настройка сигнала измерений: нажмите синюю кнопку [AUTO] в правом верхнем углу передней панели.
Установка режима медленной прокрутки: найдите крупный энкодер с надписью GEN под блоком HORIZONTAL и поверните её против часовой стрелки. Когда значение достигнет отметки 100 мс, система перейдет в режим медленной прокрутки сканирования. 100 мс ~ 50 с относятся к временной развертке режима прокрутки.
Курсор измерения времени: нажмите кнопку [H CUR], чтобы включить курсор времени.
Передвигайте курсор влево или вправо с помощью клавиш навигации влево и вправо. Для регулировки выбираемых значений вращайте по или против часовой стрелки небольшой энкодер со значками + и -, которая находится слева вверху от кнопок навигации. Курсор измерения напряжения: нажмите кнопку [V CUR], чтобы включить курсор напряжения.
Выберите мигающую линию с помощью клавиш навигации вверх/вниз. Для регулировки положения линии вращайте по или против часовой стрелки небольшой энкодер со значками + и -, которая находится слева вверху от кнопок навигации. Вращение энкодер по часовой стрелке приведет к сдвигу мигающей линии вверх, а вращение энкодер против часовой стрелки — к сдвигу вниз.
Открыть меню параметров: нажмите клавишу F1 — F6, чтобы открыть меню параметров для соответствующей ячейки на экране. Используйте кнопки навигации, либо соответствующий энкодер регулировки для выбора необходимого параметра. Снимок экрана: нажмите кнопку [S PIC], чтобы сделать снимок экрана. Изображение сохранится на локальный диск в формате BMP.
Сохранить текущие данные осциллограммы: нажмите кнопку [S WAV], чтобы сохранить все данные формы сигнала активного канала на локальный диск Регулировка яркости экрана: нажмите кнопку [MENU], выберите пункт [Screen brightness], нажмите кнопку OK и отрегулируйте яркость экрана с помощью небольшого энкодера со значками + и -, которая находится слева вверху от кнопок навигации. 100 — максимальная яркость, 0 — минимальная яркость.
Регулировка яркости фоновой сетки: нажмите кнопку [MENU], выберите пункт [Grid brightness], нажмите кнопку ОК и отрегулируйте яркость сетки с помощью небольшого энкодера со значками + и -, которая находится слева вверху от кнопок навигации. 100 — максимальная яркость, а 0 — отключить отображение сетки.
Установить постоянное значение триггера 50%: нажмите кнопку [MENU], выберите пункт [automatic 50%], нажмите кнопку ОК, а затем выберите [On] с помощью клавиш навигации. Теперь при запуске автоматического режима триггера каждая измерительная система будет автоматически устанавливать напряжение триггера на 25% / 50% / 75% от пикового значения в соответствии с характеристиками формы сигнала.
Калибровка горизонтальной базисной линии: производится, когда датчик извлечен. Необходимо отрегулировать положение желтой / голубой стрелки индикатора таким образом, чтобы она не совпадала с желтой / голубой стрелкой базисной линии любого из каналов. Сперва извлеките датчик, затем нажмите кнопку [MENU] и выберите пункт [baseline calibration], нажмите OK и откалибруйте базисную линию.
Показать сохраненные снимки экрана: нажмите кнопку [MENU], выберите пункт [Picture browse], нажмите кнопку OK для просмотра миниатюр изображений. Выберите изображение с помощью клавиш навигации. Нажмите [OK], чтобы открыть снимок экрана с осциллограммой в полноэкранном режиме. Используйте следующие кнопки для выполнения действий: RET — вернуться к просмотру эскизов изображений, SEL — выбрать все изображения, DEL — удалить, LAST — перейти в конец, NEXT — следующее изображение. Показать сохраненные данные осциллограммы: нажмите кнопку [MENU], выберите пункт [Waveform browse], нажмите кнопку OK, чтобы войти в меню предварительного просмотра эскизов сигналов. Выберите эскиз с помощью клавиш навигации, нажмите [OK], чтобы посмотреть осциллограмму в полноэкранном режиме. Используйте следующие кнопки для выполнения действий: RET — вернуться к просмотру эскизов осциллограмм, SEL — выбрать все эскизы, DEL — удалить, LAST — перейти в конец, NEXT — следующий эскиз.
Удалить сохраненный сигнал: нажмите кнопку [MENU], выберите пункт [Waveform browse], нажмите кнопку OK, чтобы войти в меню предварительного просмотра эскизов сигналов. Выберите эскиз с помощью клавиш навигации и нажмите кнопку [DEL] в нижней части передней панели, чтобы удалить эскиз сигнала. Таким же способом можно удалить сигнал и во время полноэкранного просмотра.
Просмотр снимков экрана с компьютера: нажмите кнопку [MENU], выберите пункт [USB share] и нажмите кнопку OK, чтобы открыть меню USB-синхронизации. Подключите осциллограф к компьютеру с помощью прилагаемого USB-кабеля, на компьютере появится съемный диск или U- диск. Теперь Вы можете просматривать снимки экрана осциллографа на компьютере. Не изменяйте и не переименовывайте изображения в памяти осциллографа, иначе прибор не сможет распознать и открыть их снова.
Добавить комментарий
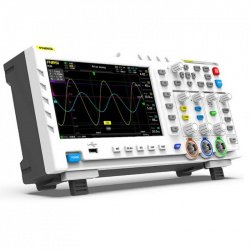
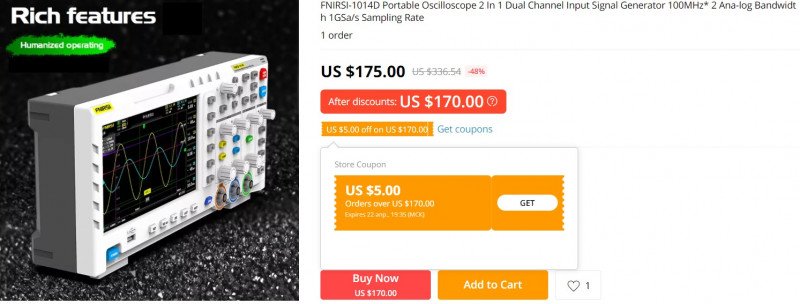
Компактный и недорогой осциллограф с двумя каналами, генератором для калибровки, большим цветным экраном, USB-портом и встроенной памятью — новинка от FNIRSI потенциально может стать «народной» моделью.
Речь пойдет про модель FNIRSI 1014D. Под катом реальные фотографии, описание модели.
Регулярно смотрю за обновлением ассортимента измерительных устройств, особенно за компактными моделями. Да и муськовчане периодически подкидывают ссылки на новинки. Так вот, буквально на днях стала доступна к заказу новая модель осциллографа FNIRSI 1014D. Из особенностей выделю большой цветной экран 7″ (800 х 480 точек), наличие USB порта и возможность запись сигналов.
Характеристики:
Model: FNIRSI 1014D
Analog band width: 100MHz х 2
Number of channels: 2 channels
Maximum real time sampling rate: 1GSa/s
Vertical sensitivity: 50 mV/div ~ 500 V/div
Horizontal time base range: 50S/div ~ 10nS/div
Maximum test voltage: 40 V (1X probe), 400 V (10X probe)
Storage depth: 240Kbit
Input resistance: 1MΩ
ADC precision: 8bits
Coupling mode: AC/DC
Trigger mode: Single, Normal, Auto
Trigger edge: Rising edge/Falling edge
External trigger voltage 0~40 V
Extension ports: USB picture export
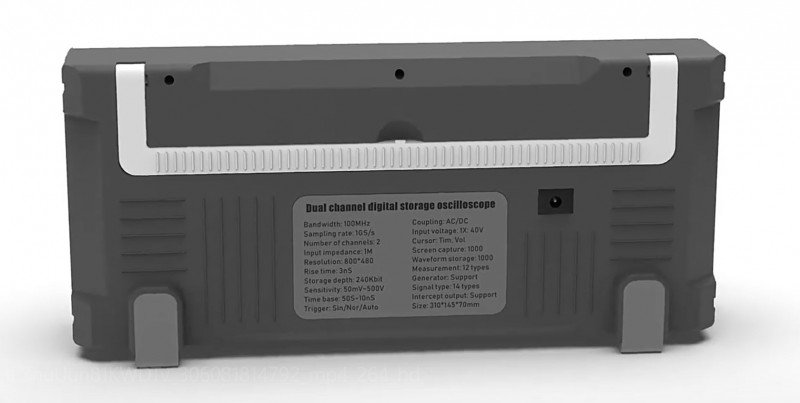
Package size: 340 * 140 * 70mm
Package weight: 1500g
Данная модель — нечто среднее между карманными осциллографическими пробниками (коих здесь множество обзоров), и полноценными настольными моделями. Размер корпуса — 43 х 14 см при толщине 7 см (с учетом ручек). Отличный вариант для радиолюбителей, начинающих электронщиков, а также для ремонтников.

Работает от внешнего питания 5В (USB на круглый джек), в комплекте есть 2 щупа (P6100, с калибровкой, до 100 МГц).
Всего два канала, есть выход встроенного генератора частоты.
Отмечу наличие функции преобразования Фурье (FFT), то есть в каких-то пределах можно просматривать спектр сигналов (обычно, это платная опция, либо только в дорогих моделях).
Минимальное разрешение по вертикали — 50 mV/div. Это ограничение накладывается используемой схемотехникой.
Встроенный генератор частоты имеет 14 типов сигналов. Максимальная выходная частота синусоиды — 10 МГц, сложных сигналов до 2 МГц.
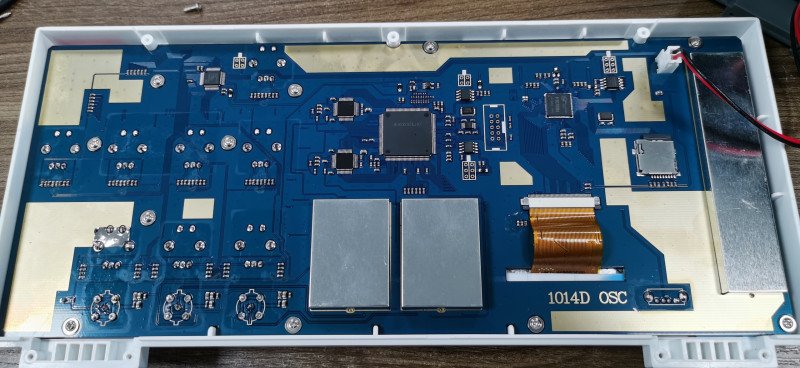
В качестве центрального процессора используется чип SoC Allwinner F1C100s (ARM926EJ-S) со встроенной памятью 32MB DDR SDRAM. Объем флешпамяти — 1 Гб.
Используются два двухканальных АЦП, обещанная аналоговая полоса — 1 Gs/s. Обработкой занимается отдельная ПЛИС. Насколько это реально не могу сказать, скорее всего это значение указывается с учетом современных алгоритмов цифровой обработки сигналов (стробоскопическая осциллография и прочее угадывание формы периодических сигналов).
Максимум на вход можно подавать до 40 Вольт. С делителем на щупе 10х — до 400 В. Если использовать щупы типа Р4100 (100:1), то можно и больше. Таким образом, можно проверять высоковольтные цепи, цепи блоков питания, выходные каскады ШИМ-преобразователей и т.п.
Видеоролик с внешним видом и примером работы.
Но, в целом, новинка стоящая. За похожие деньги я даже не могу ничего посоветовать, подобного же уровня. Приличные настольные модели начинаются от $300 (а то и $350), так что можно смело плюсовать на оплату пошлины и комиссии.
Кстати, FNIRSI 1014D не попадает под налоги, так как цена ниже $200.
А конкретно, с купоном, цена $170.
Я себе заказал, одним из первых. Посмотрим, что реально выдает эта модель.
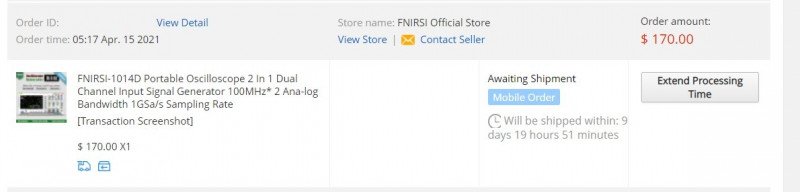
Продавец — официальный магазин FNIRSI — осуществляет и поддержку. Обмен/возврат/запчасти/прошивки.
Если интересно, можно посмотреть аналоги — ADS1014D, но по этой модели мне не удалось найти информации.

fix:
г. Архангельск, ул. Иоанна Кронштадтского, д. 16:
 — мало
г. Астрахань, ул. Савушкина, д. 46:
— мало
г. Волгоград, ул. Рабоче-Крестьянская, д. 14:
 — отсутствует
г. Воронеж, ул. Фридриха Энгельса, д. 56:
— отсутствует
г. Екатеринбург, ул. Героев России, д. 2, ТЦ Свердловск:
— отсутствует
г. Екатеринбург, ул. Уральская, д. 3:
— мало
г. Иваново, проспект Ленина, д.9:
— отсутствует
г. Ижевск, ул. Вадима Сивкова, д.150, ТЦ Европа:
— отсутствует
г. Казань, ул. Декабристов, д. 158:
— отсутствует
г. Казань, ул. Спартаковская, д. 2, ТК «Караван галерея»:
— мало
г. Калининград, ул. Генерала Соммера, дом 9-11:
— отсутствует
г. Кемерово, ул. Пролетарская, д.3:
— отсутствует
г. Кострома, ул. Советская, д. 119, пом. 48:
— отсутствует
г. Краснодар, ул. Коммунаров, д. 102:
— мало
г. Краснодар, ул. Тургенева д 35/1:
— отсутствует
г. Красноярск, ул. Вавилова, д.1, стр.39, ТК «Атмосфера», пав. 11:
— отсутствует
г. Москва, Багратионовский пр-д, 7, ТЦ «Горбушкин Двор», пав. С2-006а:
— отсутствует
г. Москва, Варшавское шоссе, вл. 132/2, пав. М-1:
— мало
г. Москва, Пятницкое ш., 18, ТК «Митинский радиорынок», пав. 401/402, 1-й этаж:
— отсутствует
г. Москва, ул. Генерала Белова, д. 29, ТЦ Фея:
— отсутствует
г. Москва, ул. Профсоюзная, 56, ТЦ «Черемушки», пав. 1Г14:
— мало
г. Москва, ул. Сущевский вал, д. 5 стр. 12, ТК Мобильный, пав. Л-140:
— отсутствует
г. Москва, ул. Сущевский вал, д.5, стр. 12, ТК Мобильный, пав. Т32/34:
— отсутствует
г. Набережные Челны, Московский проспект, д. 126А, ТК «Кама»:
— отсутствует
г. Нижний Новгород, ул. Композитора Касьянова, д. 6 Г, модуль 4, отдел Е1:
— отсутствует
г. Нижний Новгород, ул.Советская, д. 12:
— мало
г. Новокузнецк, проспект Курако, д. 16:
— отсутствует
г. Новосибирск, ул. Крылова 26, ТЦ Москва:
— отсутствует
г. Омск, пр-т Карла Маркса. д. 29 А:
— отсутствует
г. Оренбург, ул. 8 марта, д. 49, помещение 3:
— отсутствует
г. Пенза, ул. Володарского 78 (угол с ул. Бакунина, д.62):
— отсутствует
г. Пермь, ш. Космонавтов, 10А:
— отсутствует
г. Ростов-на-Дону, ул. Серафимовича, д. 50:
— отсутствует
г. Рязань, пр-т Первомайский, дом 21/24:
— отсутствует
г. Самара, ул. Победы д. 105:
— отсутствует
г. Самара, ул. Победы, д. 81 (вход с ул. Средне-Садовая):
— отсутствует
г. Санкт-Петербург, Большая Разночинная ул., д.6:
— отсутствует
г. Санкт-Петербург, Московский пр., д.193:
— отсутствует
г. Санкт-Петербург, пр. Энгельса, д.137, лит А:
— мало
г. Санкт-Петербург, ул, Дыбенко, д.20, к.1:
— отсутствует
г. Санкт-Петербург, ул. Ильюшина, д. 8:
— отсутствует
г. Санкт-Петербург, ул. Марата, д. 22-24:
— отсутствует
г. Саратов, ул. Московская, д. 106:
— мало
г. Смоленск, ул. Беляева, д. 6:
— отсутствует
г. Ставрополь, ул. Лермонтова, д. 193:
— отсутствует
г. Тольятти, ул. Революционная, д. 52, ТД ДБ «Орбита», 1 этаж, 111 секция:
— мало
г. Тюмень, ул. Герцена, д.95А:
— отсутствует
г. Уфа, ул. Комсомольская, д. 15 (вход со стороны ул. Бессонова):
— отсутствует
г. Чебоксары, ул.Композиторов Воробьевых, д.20, ТРЦ «Дом Мод», 1-й этаж:
— отсутствует
г. Челябинск, проспект Победы, д.162:
— отсутствует
г. Челябинск, ул. Цвиллинга, д. 58:
— отсутствует
г. Череповец, ул. Металлургов, д.7:
— отсутствует
г. Ярославль, ул. Свободы, д .13:
— отсутствует
ГО Сочи, г. Адлер, ул. Демократическая 53/А, ТЦ Пассаж:
— отсутствует
ОПТОВЫЙ СКЛАД: г. Москва, 2 хорошевский проезд, д. 7, стр.1:
— отсутствует
Двухканальный измерительный прибор 2 в 1: запоминающий осциллограф и DDS генератор сигналов с 14-битным разрешением. 1014D имеет встроенную память 1 Гб, которая позволяет хранить до 1000 скриншотов экрана и форм сигналов.
На передней панели внизу находится кнопка GEN, благодаря которой вызывается встроенный генератор с максимальной полосой пропускания 10 МГц (синусоидальный сигнал. Предусмотрено 14 предустановленных функций.
Кнопка AUTO автоматически настраивает необходимый сигнал измерений.
Отличительной особенностью устройства является большой 7-дюймовый LCD дисплей с разрешением экрана 800 на 480 пикселей. Встроенный USB разъем позволяет пользователям передавать необходимые данные на свой ПК.
Работает осциллограф от внешнего 5-вольтного источника питания.
Есть функция быстрого преобразования Фурье (FFT), которая способна в заданном пределе просматривать спектр сигналов.
Характеристики:
- Количество каналов: 2;
- Полоса пропускания: 100 МГц;
- Частота дискретизации: 1 ГВыб/с;
- Глубина записи: 240 Кб;
- Развязка входа: DC, AC;
- Входной импеданс: 1 Мом;
- Установка коэффициента затухания датчика: 1 Х, 10 Х;
- Максимальное входное напряжение: 40 В (1 X), 400 В (10 Х) ;
- Коэффициент развёртки горизонтальный системы: 50 с / дел — 10 нс / дел;
- Вертикальная развёртка: 50 мВ / дел — 500 В / дел;
- Время нарастания: < 3 нс;
- Вертикальное разрешение: 8 бит;
- Точность напряжения: ± 5%;
- Режимы синхронизации: автоматический, нормальный, однократный;
- Режим триггера: по фронту (спадающему / ниспадающему) ;
- Курсорные измерения: XY, триггер Y;
- Математические операции: FFT;
- Форма сигналов: 14 видов форм сигналов;
- Полоса пропускания: 10 МГц (синусоидальный сигнал), разрешение 1 Гц;
- Вертикальное разрешение: 14 бит;
- Дисплей: цветной TFT-дисплей, 7 дюймов, 800 x 480;
- Интерфейс: USB (5 В / 2 А) ;
- Встроенная память: 1 Гб;
- Хранение формы волны: 1000 изображений + 1000 сигналов;
- Возможность сохранения осциллограмм: есть;
- Функция автоматического измерения: есть;
- Функция Roll: есть;
- Функция Лиссажу: есть;
- Функция регулировки яркости экрана: есть;
Комплектация:
- Осциллограф FNIRSI 1014D — 1 шт;
- Щупы для осциллографа — 2 шт;
- USB кабель — 1 шт;
- Кабель питания — 1 шт;
- Зажим BNC-крокодил — 1 шт;
- Инструкция по эксплуатации — 1 шт.
Габаритные размеры упаковки:
- Вес: 1,6 кг
- ДхШхВ (см): 38x21x12,5
Инструкция (Осциллограф_Fnirsi_1014D.pdf, 579 Kb) [Скачать]
Product introduction
FNIRSI-1014D is a two in one oscilloscope and signal generator launched by FNIRSI, with comprehensive functions and high practicability. It is a cost-effective dual channel desktop oscilloscope for the maintenance industry and R & D industry. The oscilloscope has a real-time sampling rate of 1GSa / s, 100MHz* 2 analog bandwidth; complete trigger function (single time / normal I automatic), both for periodic analog signal and aperiodic digital signal can be used freely; built in DDS function signal generator and the industry’s original chopping output (@ 2.5VPP), all signal frequency step is 1Hz, support 14 kinds of standard function signal and a customizable chopping signal, chopping The output device intercepts part or the whole part of the complex signals measured by the oscilloscope as the output signal of the signal generator, which can store up to 1000 customized cut-off signals; the built-in high-voltage protection module can tolerate up to 400V continuous voltage, without worrying about the oscilloscope burning accident caused by the probe not moving to 10x gear. Large time base scrolling mode, which can monitor the slow level change; equipped with efficient one button auto, self-adaptive 25%, 50%, 75% trigger, which can display the measured waveform without complicated adjustment; the display is equipped with 7-inch 800 * 480 resolution high-definition LCD screen; cursor measurement function, which can read the amplitude and frequency parameters manually without reading the background scale unit and quantity, and without conversion To get the peak and frequency directly; extremely convenient screen capture and waveform storage function, built-in 1GB storage space, can store up to 1000 screen capture pictures + 1000 groups of waveform data, the storage process is simple and fast, save the current waveform, just a click to save the current data, very convenient; powerful waveform image manager, support thumbnail browsing, view, view details The functions of page turning, deleting and waveform enlarging, reducing and moving are convenient for secondary analysis. The fuselage is equipped with USB interface, which can be connected with the computer to realize the sharing of its own screen capture pictures and the computer, which is convenient for secondary analysis; Lissajous graphic display function can be used to compare and judge the amplitude, frequency and phase of two groups of signals; FFT viewing function can roughly estimate the harmonic component of the signal; Li Shayu’s graphic display function can be used to compare and judge the amplitude, frequency and phase of two groups of signals;
Serious warning!
1: When the two channels are used at the same time, the ground clamps of the two probes must be connected together. It is strictly forbidden to connect the ground clamps of the two probes to different potentials, especially the different potential terminals of high-power equipment or 220 v. otherwise, the oscilloscope motherboard will be burned. Because the two channels are grounded together, connecting to different potentials will lead to the short circuit of the internal ground wires of the motherboard, and all oscilloscopes are same;
2: The BNC input of oscilloscope can withstand 400V voltage at most It is strictly forbidden to input more than 400V voltage in the position of 1x probe
3: The original power supply must be used. It is strictly forbidden to use the power supply or USB of other devices under test. Otherwise, the motherboard ground wire may be short circuited during the test
4: 100x probe (such as ultrasonic welding machine, ultrasonic cleaning machine, etc.) or even 1000x probe (such as high-voltage end of high-frequency transformer, coil of induction cooker, etc.) must be used to measure high-frequency and high-voltage signal
Solemnly remind
the bandwidth of 1x probe is 5MHz, and the bandwidth of 10x probe is 100MHz. When the measurement frequency is higher than 5MHz, the switch on the probe handle needs to be moved to 10x, and the oscilloscope also needs to be set to 10x. Otherwise, the signal will be greatly attenuated, which is the case with all oscilloscopes. Because the probe line of the oscilloscope itself has a capacitance as high as 100 ~ 300pf, which is a big capacitance for high frequency signal! The signal has been greatly attenuated when it reaches the input end of the oscilloscope through the probe, and the equivalent bandwidth is 5MHz. Therefore, in order to match the hundreds of PF of the probe line, the input end of the probe line will be attenuated 10 times (the switch is in the 10x gear), so that the hundreds of PF capacitor is just used for impedance matching. At this time, the bandwidth is 100MHz. Note that only probes with 100MHz bandwidth or above can be used
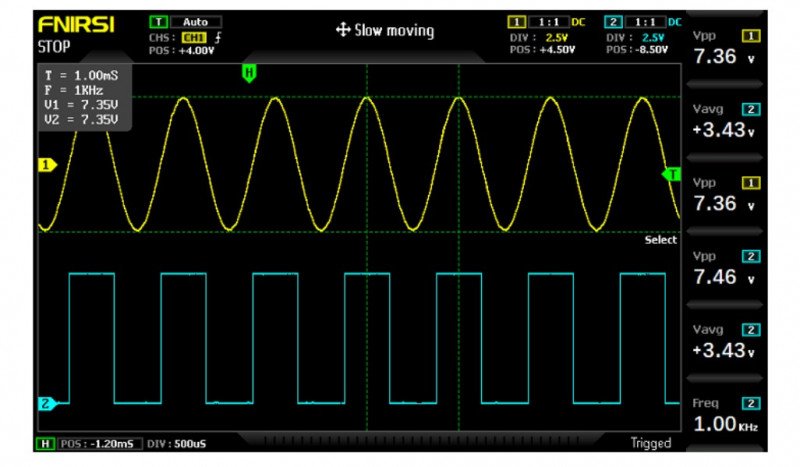
Interlace function indicator diagram

- 1: Run pause indicator
- 2: The trigger x position indication arrow indicates that this is the trigger x point
- 3: Background grid tick marks
- 4: Waveform data of channel 1
- 5: The baseline position of channel 1 indicates the arrow, that is, the position of 0V potential
- 6: Waveform data of channel 2
- 7: The baseline position of channel 2 indicates the arrow, that is, the position of 0V potential
- 8: Horizontal time base control bar flag
- 9: Trigger the position of the X arrow relative to the system coordinate system
- 10: Horizontal time base refers to the length of time represented by a large grid in the horizontal direction, which is determined by the sampling rate. The larger the time base is, the slower the sampling rate is, and vice versa
- 11: Trigger status flag
- 12: Column 6 measurement parameters, press F6 to select measurement parameters freely
- 13: Column 5 measurement parameters, press F5 to select measurement parameters freely
- 14: Column 4 measurement parameters, press F4 to select measurement parameters freely
- 15: Column 3 measurement parameters, press F3 to select measurement parameters freely
- 16: Column 2 measurement parameters, press F2 to select measurement parameters freely
- 17: Column 1 measurement parameters, press F1 to select measurement parameters freely
- 18: Channel 2 control bar sign
- 19: The input coupling mode of channel 1 has two options: DC and ac. DC means DC coupling and AC means AC coupling
- 20: Channel 1 probe magnification
- 21: Channel 1 control bar sign
- 22: vertical sensitivity of channel 1 refers to the voltage represented by a large grid in the vertical direction
- 23: Channel 1 baseline arrow position relative to the system coordinate system
- 24: movement speed of waveform operation, fast movement is used for coarse adjustment, and slow movement is used for fine adjustment
- 25: trigger voltage arrow position relative to the system coordinate system
- 26: trigger edge indicator, arrow up to rising edge trigger, arrow down to falling edge trigger
- 27: trigger mode indicator, divided into auto, single and normal; auto is automatic trigger, sinle is single trigger and normal is normal trigger
- 28: trigger control bar flag29: trigger channel, divided into ch1 and CH2 options
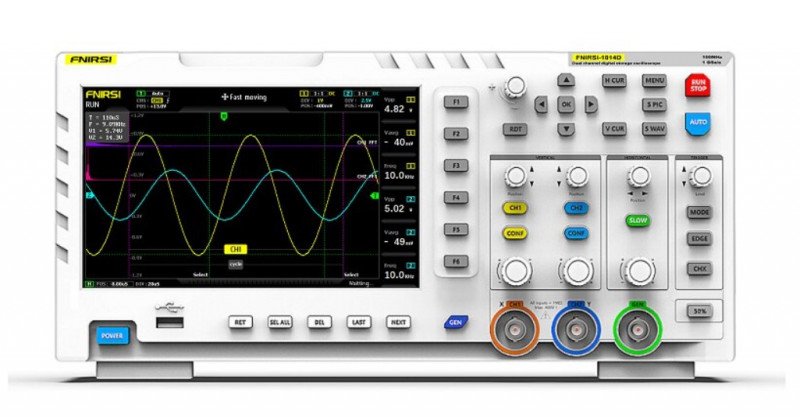
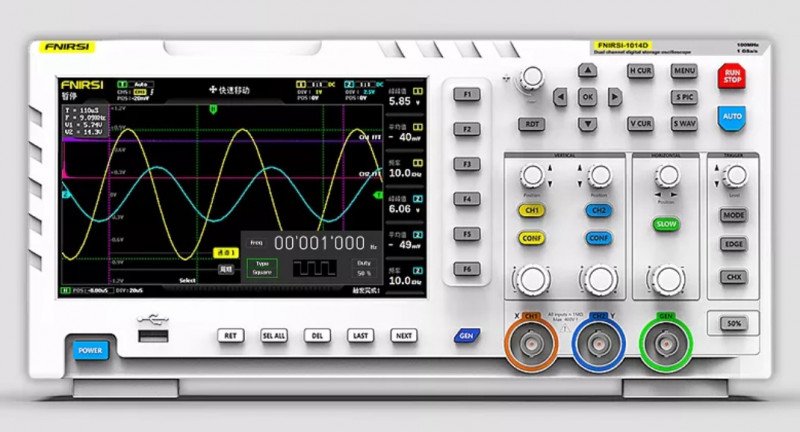
Button function indication diagram

- 1: Run I pause button. Click this button to pause sampling at anytime
- 2: One key automatic adjustment button, click this button, the system will automatically identify the signal and set the system to the best parameters to display this waveform
- 3: Function menu button, click here to pop up the function menu
- 4: One click screen capture button. Click this button to take a screen capture of the whole screen and save it to the internal storage space automatically
- 5: One button save waveform button, click this button will save all waveform data of the two channels to the internal storage space
- 6: Time cursor switch button, click this button to turn on and off the cursor measurement function
- 7: Press the voltage cursor switch key to turn on and off the cursor measurement function
- 8: System [right] navigation key
- 9: System navigation key
- 10: System [OK] navigation key
- 11: System navigation key
- 12: System [left] navigation key
- 13: Move speed button. Click this button to switch between fast move and slow move
- 14: Channel 1 vertical position adjustment knob, rotate clockwise to move up, rotate counterclockwise to move down
- 15: Channel 1 switch button. Click this button to turn on or off the waveform display of channel 1
- 16: Channel 1 control bar button. Click this button to pop up the control parameters related to channel 1, which can be selected according to the navigation key or the knob next to it
- 17: Channel 1 vertical sensitivity adjustment knob, clockwise vertical amplification, counterclockwise vertical reduction
- 18: Channel 1 signal input port, the measurement range is 0 ~ 40V peak to peak, pay attention to the maximum tolerance of 400V peak to peak withstand voltage
- 19: Channel 2 vertical position adjustment knob, rotate clockwise to move up, rotate counterclockwise to move down
- 20: Channel 2 switch button. Click this button to turn on or off the waveform display of channel 2
- 21: Channel 2 control bar button. Click this button to pop up the control parameters related to channel 2, which can be selected according to the navigation key or the knob next to it
- 22: Channel 2 vertical sensitivity adjustment knob, clockwise vertical amplification, counterclockwise vertical reduction
- 23: Channel 2 signal input port, the measurement range is 0 ~ 40V peak to peak, pay attention to the maximum tolerance of 400V peak to peak withstand voltage
- 24: the system triggers the x position adjustment knob to move clockwise to the right and counterclockwise to the left
- 25: one key return to center button, after clicking this button, channel 1, channel 2 vertical position, trigger x horizontal position, trigger y vertical position will return to center
- 26: the time base adjustment knob is rotated clockwise to reduce the time base, that is, to enlarge the waveform horizontally, and counterclockwise to increase the time base, that is, to reduce the waveform horizontally
- 27: DDS signal generator output
- 28: trigger voltage y position adjustment knob, rotate clockwise to move up, rotate counterclockwise to move down
- 29: trigger mode switch button, divided into auto, single and normal
- 30: trigger edge switch button, divided into rising edge and falling edge
- 31: trigger channel switch button, divided into channel 1 and channel 2
- 32: 50% trigger button, click this button, the system will automatically set the current trigger voltage to 25%, 50%, 75% according to the signal characteristics to trigger
- 33: the first column measurement parameter selection button, after the measurement block diagram pops up, you can select according to the navigation key or the knob next to it
- 34: the second column measurement parameter selection button, after the measurement block diagram pops up, you can select according to the navigation key or the knob next to it
- 35: the measurement parameter selection button in column 3, after the measurement block diagram pops up, you can select according to the navigation key or the knob next to it
- 36: the measurement parameter selection button in column 4, after the measurement block diagram pops up, you can select according to the navigation key or the knob beside it37: the measurement parameter selection button in column 5 pops up the measurement block diagram, which can be selected according to the navigation key or the knob beside it
- 38: the measurement parameter selection button in column 6, after the measurement block diagram pops up, you can select according to the navigation key or the knob beside it
- 39: signal generator control bar button, click this button will pop up the signal generator parameter control bar, you can select according to the navigation key or the knob next to it
- 40: next page of the control button on the next page of picture / waveform / chopping Manager
- 41: picture / waveform / chopped wave manager next page control button [previous page]
- 42: [delete] of the control button on the next page of picture / waveform I chopping Manager
- 43: select all of the control buttons on the next page of picture / waveform I chopping Manager
- 44: [return] of the control button on the next page of picture I waveform I chopping Manager
- 45: USB port for sharing screenshots
- 46: power switch, click to start or shut down operation
Operating instructions [oscilloscope part]
Open or close channel 1 / Channel 2: click [chi ] / [CH2] to open or close ch1 / CH2 Turn FFT on or off: click the [conf] button under ch1 or CH2, the parameter control bar of channel 1 / Channel 2 will pop up, and then turn FFT on / off through the navigation key
Setting input coupling mode: click [conf] under ch1 or CH2 to pop up the parameter control bar of channel 11 Channel 2, and then switch DC / AC through the navigation key
Set the probe input ratio: click [conf] under ch1 or CH2, the parameter control bar of channel 1 I Channel 2 will pop up, and then switch to 1x/ 10x/ 100x through the navigation key
Scaling waveform: rotate the large knob at the bottom left corner of vertical frame to scale the waveform of channel 1 vertically, and rotate the large knob at the bottom right corner to scale the waveform of channel 2 vertically; rotate the large knob at the bottom of horizontal frame to scale the waveform of channel 1 and channel 2 horizontally, clockwise to enlarge, counterclockwise to reduce
Moving waveform: rotate the small knob in the upper left corner of vertical frame to move the waveform of channel 1 vertically, and rotate the small knob in the upper right corner to move the waveform of channel 2 vertically, which moves clockwise upward and counterclockwise downward; rotate the small knob in the upper horizontal frame to move the waveform of channel 1 and channel 2 horizontally, which moves clockwise to the right and anticlockwise to the left In the process, you can click the [slow] button to select coarse adjustment or fine adjustment
Adjust trigger voltage: rotate the small knob under the trigger frame to adjust the trigger voltage. In this process, you can click the [slow] button to select coarse adjustment or fine adjustment. Pay attention to turn off the [automatic 50%] trigger in the menu first, otherwise the trigger voltage cannot be adjusted
Set trigger edge: click edge to switch rising edge I falling edge
Set auto trigger: click mode to switch between auto I single I normal, where auto is auto trigger
Set single trigger: click mode to switch between auto I single I normal, where single is single trigger
Set normal trigger: click mode to switch between auto I single / normal, where normal is normal trigger
Pause display: click the red [run I stop] button in the upper right corner to pause or run
Automatic waveform adjustment: click the blue [auto] button in the upper right corner to adjust automatically
Set the slow scan scrolling mode: rotate the big knob under the horizantal frame counterclockwise. When the base reaches 100ms, the system will enter the slow scan scrolling mode. 100ms ~ 50s belong to the time base of the scrolling mode
Time cursor measurement: click the [H cur] button to turn on the time cursor, and then select the left and right light markings by the left and right keys of the navigation key, and finally adjust them by the small knob in the upper left corner of the navigation key, in which the light markings are moved to the right by clockwise rotation and to the left by counterclockwise rotation
Voltage cursor measurement: click the [v cur] button to turn on the voltage cursor, and then select the up and down light marking lines by the up and down keys of the navigation key, and finally adjust them by the small knob in the upper left corner of the navigation key, in which the light marking lines are moved upward by clockwise rotation and downward by counterclockwise rotation
Set the parameters to be displayed: click F1 ~ F6 to pop up the parameter measurement control bar, and select the currently required parameters through the navigation key or the nearby knob
Full screen capture: click the [s pic] button to capture the current display. The captured image is saved to the local disk in BMP format
Save current waveform data: click the [s wav] button to save all waveform data of the opened channel to the local disk
Adjust the screen brightness: click the [menu] button, navigate to the [screen brightness], press the OK key, and finally adjust the screen brightness through the small knob in the upper left corner. 100 is the brightest and 0 is the darkest
Adjust the background grid brightness: click the [menu] key, navigate to the [grid brightness], press the OK key, and finally adjust the grid brightness through the small knob in the upper left corner. 100 is the brightest, and 0 is to turn off the grid display
Setting automatic 50% trigger all the time: click the [menu] key, navigate to [automatic 50%], press the OK key, and then select [on] through the navigation key. After setting, in the automatic trigger mode, each measurement system will automatically set the trigger voltage to 25% 150% 175% of the peak to peak value according to the waveform characteristics
Horizontal baseline offset calibration: when the probe has been pulled out, when the left yellow I cyan indicator arrow and the Yellow I cyan horizontal baseline of either channel are not in the same position, calibration is required; first pull out the probe, then click the [menu] key, navigate to [baseline calibration], and then press the OK key to calibrate the baseline
View the saved screen capture: click [menu], navigate to [picture browse], and then press the OK key to enter the picture thumbnail preview interface, which is the thumbnail of the captured waveform. Select the thumbnail through the navigation key, and then click [OK] to view the screen capture of the waveform in full screen, with (RET) return at the bottom, (SEL) All), (DEL), (last), (next) the next control button can be operated
View the saved waveform data: click [menu] key, navigate to [waveform browse], and then press the OK key to enter the waveform thumbnail preview interface, where is the waveform thumbnail. Select the thumbnail through the navigation key, and then click [OK] to view the waveform in full screen, with (RET) return at the bottom, (SEL) All), (DEL), (last), (next) the next control button can be operated
Delete the saved waveform: click the [menu] key, navigate to [waveform browse]. and then press the OK key to enter the waveform thumbnail preview interface, where is the waveform thumbnail. Select the thumbnail through the navigation key, and then click the [del] key at the bottom to delete the waveform, or click the key to delete it in full screen view
Connect the computer to view the screen capture pictures: click the [menu] button, navigate to the [USB share] through the navigation key, and then press the OK key to open the USB share. Then connect the computer with the attached USB cable, and the computer will pop up the removable disk or U-disk. You can find the screen capture pictures saved in the disk in the computer. Note that you can’t repair them directly in the disk Change the file name of the picture, otherwise the oscilloscope picture manager will not be able to display the picture
Operation instruction (signal generator part)
Switch the waveform type: click the [Gen] button, the signal generator control interface will pop up in the lower right corner of the screen, and then click the [OK] button to switch the green selection box to the [waveform type] position, and then click the [up] or [down] in the navigation key or the button in the upper left corner of the navigation key to switch the waveform type
Adjust the waveform frequency: click the [Gen] button, the signal generator control interface will pop up in the lower right corner of the screen, and then click the [OK] button to switch the green selection box to the [frequency] position, and then click the [left] or [right] in the navigation key to set the position cursor, that is, to set the division to be adjusted. After confirming, press the [up] or [down] or the [up] button in the upper left corner of the navigation key The knob can increase or decrease the value of the current bit, thus changing the frequency
Adjust the duty cycle of square wave: the duty cycle setting is only effective for square wave. It can only be set when the waveform type is square wave. Other waveforms have no concept of duty cycle. Click the [Gen] button, the signal generator control interface will pop up in the lower right corner of the screen, and then click the [OK] button to switch the green selection box to the [duty cycle] position, and then rotate the navigation key in the upper left corner You can increase or decrease the duty cycle with the knob of 1 % ~ 99%
Capture waveform: Capture waveform output is to capture part or the whole part of the current displayed waveform as the output of signal generator. The captured signal can be saved to the system, and up to 1000 groups of captured signals can be saved.
First, click the [menu] button, the function interface will pop up on the left side of the screen, and then locate it to the capture output] position through the navigation key and open it on the screen Two purple boundary lines will pop up. The waveform within the two boundary lines is the waveform segment to be captured .The word select indicates that the boundary line is the boundary line operated by the current knob. You can switch and select the current operation line through the [left] and [right] keys of the navigation key. After setting the boundary line, you can go up to the left through the navigation key When adjusting, you can click the [slow] key to set coarse and fine adjustment; there is a word ‘channel 1 I Channel 2″ in the middle of the two boundary lines, which means that the current captured signal is channel 1 I Channel 2 signal, and you can select the channel through the [up] [down] of the navigation key; the left boundary line is marked with voltage scale, which is used to refer to the captured wave If you want to adjust the chopping level position, you can adjust the offset by adjusting the Y position of the channel. For example, if you captured a DC signal and adjust the DC waveform to + 1V position, then the output is + 1V voltage, and adjust to – 1V, then the output is – 1V voltage; If you want to adjust the sampling amplitude of chopped wave, you can adjust the vertical sensitivity of the channel to scale the waveform vertically. It is recommended to first amplify the signal amplitude to the maximum, but not to cut the top, and then capture so that the output signal will have enough sampling data, the output waveform distortion will be smaller, and the resolution will be higher. If you only capture a very small signal, and then capture it Output, and then through the oscilloscope measurement to enlarge it, the waveform will appear a very serious ladder phenomenon, because the sampling is insufficient, the effective signal is too little, just like the original image is very small, but forced to enlarge, the image is bound to be fuzzy; after all the parameters are determined, click the [OK] key, the cut-off will be saved to the system disk
Output the captured waveform as the signal generator: first click the [Gen] button to open the signal generator interface, then click the [OK] button to switch the green selection box to the [waveform type] position, and then click the [up] and [down] in the navigation key to switch it to “self definition”, then click the [Gen] button to exit the signal generator control interface, and then click the [MENU] button, the function interface will pop up on the left side of the screen, and then navigate it to the [output browsing] position and open it. All saved captured signals will be listed on the screen, and then the selection box will be moved to the desired signal position through the navigation key. Click the [OK] key, and the Yellow word “output” will pop up in the upper left corner of the waveform, which means that the current custom signal selection bit of the waveform Then click [menu] to exit, and the waveform output by the signal generator is the captured signal. It should be noted that if the captured waveform is a single cycle waveform, that is, there is only one cycle in the two bound ary lines, then the output frequency of the signal generator is equal to the frequency set by the signal generator. If the captured waveform frequency contains N cycles, then the output frequency of the signal generator is n times of the set frequency, and the trigger voltage should be adjusted to the minimum edge of the waveform In other words, the intersection point between the waveform and the trigger line is the least, otherwise the displayed frequency may be several times of the actual frequency, because the calculated frequency of the oscilloscope is the frequency obtained by calculating the number of edges from the trigger line, so the wrong edge of the positioning may also lead to frequency doubling
Analysis of common problems
1: Why can’t I turn on the machine after receiving it?
Answer: please check whether the power cord is connected to the oscilloscope and whether the socket is powered. If all are correct, please replace a mobile phone charging head and test it. If it is still unable to start, please contact customer service for replacement
2: Why is there no waveform in the test, only one line on the screen is still?
Answer: please check whether the pause has been pressed. If not, press the [auto] button once. If not, it may be a problem that the signal source has no signal output, or the probe line may be short circuited or open circuit. Please check whether the probe and signal source are normal with multimeter
3: Why is the voltage value data 0?
Answer: please adjust the vertical sensitivity and time base (sampling rate), or press [auto] screen to display at least a clear and complete periodic waveform, and the top and bottom of the waveform should be displayed on the screen completely without cutting the top. The voltage value data is correct at this time
4: Why is the frequency value data 0?
Answer: first, it is necessary to ensure that the trigger mode is auto automatic triggering. If it is still 0 in auto mode, press [auto] button once. At least a clear and complete periodic waveform is displayed on the screen, and the waveform should be triggered (the green arrow indicates that the position is fixed between the wave shape and the wave shape without shaking). The data of frequency value is correct
5: Why is the duty cycle 0?
Answer: first, it is necessary to ensure that the trigger mode is auto automatic triggering. If it is still 0 in auto mode, it may be that the trigger is not adjusted to the waveform. After the trigger line is adjusted to the waveform, the waveform will be fixed. Moreover, the data of duty cycle will be correct only after at least one clear periodic waveform is displayed on the screen
6: Why is AC coupling the same as DC coupling waveform?
Answer: if the input signal is a symmetrical AC signal (such as domestic 220V), the AC coupling or DC coupling waveform are the same. If it is an asymmetric AC signal or a DC pulse signal, the waveform will move up and down when the coupling is switched
7: Why does the waveform run up and down when testing the signal, and can’t see the waveform only see multiple online and offline beats?
Answer: set trigger mode to auto auto trigger, and then press [auto] button once. If it is not solved, the clamp on the probe may not be grounded or the probe clamp end is open circuit. Please check whether the probe is normal with multimeter
8: Why does the test waveform shake around and cannot be fixed?
Answer: the trigger voltage needs to be adjusted, that is, the green arrow on the right needs to adjust the green indicator to the top and bottom of the waveform. The waveform is triggered and fixed, or the setting menu is entered to turn on “automatic 50%.”
9: Why can’t we capture sudden pulse waves or digital logic signals?
Answer: adjust the trigger mode to “Normal” or “Single”, then adjust the trigger voltage and time base and vertical sensitivity, and finally touch the pause.
10: Why does trigger voltage regulation not respond?
Answer: click menu – Auto 50% to close it
11 : Why do you measure a battery or other DC voltage without waveform?
Answer: battery voltage signal is stable DC signal, there is no curve waveform, in DC coupled mode, and then adjust vertical sensitivity, there will be an upward or downward offset straight line waveform, if it is AC coupling, no matter how to adjust, there is no waveform.
12: why do we measure the 220V power frequency 50Hz wave?
Answer: if the oscilloscope displays 50Hz low frequency signal, the sampling rate needs to be very low to capture 50Hz signal. If the sampling rate is low, the oscilloscope will enter the waiting, so it will show “card change”. All oscilloscopes in the world will change their cards when measuring 50Hz signals, not because the oscilloscope itself is stuck
13: Why is the peak value of VPP more than 600 V and not 220V or 310V when measuring the voltage waveform of the city power?
Answer: the city power 220V is a symmetrical AC signal, the positive peak voltage (maximum value) is +31 Ov, the negative peak voltage (minimum value) is -310v, so the peak peak value is 620V, the switching parameter is the effective value. At this time, it is often said that the voltage of 220V, the effective value of the municipal voltage fluctuates from 180 to 260V, so the peak VPP is in the range of 507-733v
14: Why is the measured voltage of 220V not a standard sine wave, there is distortion?
Answer: in the municipal power grid, there are generally pollution, and there are more high-order harmonic components. These harmonics will show a distorted sine wave and normal phenomenon when superimposed on the sine wave. Generally, the shape of the city electric wave is distorted, and it is irrelevant to the oscilloscope itself
15: Why is there a large offset between the baseline (0V) and the left arrow (0V indication) on the screen under no signal input?
Answer: first pull out the probe, then click [menu] button, navigate to [baseline calibration], then press OK, and wait for baseline calibration to complete, the baseline and arrow coincide
16: Why is the signal voltage above 5MHz measured attenuated significantly, and the bandwidth is only 5MHz?
Answer: when measuring 5MHz or more, it is necessary to move the probe to 10x gear and the oscilloscope should be set to 10x input mode, because the probe line of the oscilloscope has a capacitance of up to 100-300pf, which is a big capacitance for high frequency signal! The signal has been greatly attenuated when it reaches the input end of the oscilloscope through the probe, and the equivalent bandwidth is 5MHz. So in order to match hundreds of PF of probe line, it will be decayed 10 times at the input end of probe line (switch is in 10x), so that these hundreds of PF capacitors are just used for impedance matching. At this time, the bandwidth is 100MHz. Note that only the supporting 100MHz probe can be used
Test methods of common circuits
Battery or DC voltage measurement
Gear selection: the battery voltage is generally below 40V, other DC voltage is uncertain, so it is necessary to adjust the gear according to the actual situation. If it is higher than 40V (both probe and oscilloscope are set to the same gear)
1: Firstly, the oscilloscope is set to auto trigger mode (auto trigger mode is default after startup), and auto trigger mode is used to test the cycle signal (DC voltage belongs to the periodic signal)
2: The oscilloscope probe multiplier is set to the corresponding gear (default is 1x after startup)
3: Oscilloscope coupling mode is set to DC coupling mode
4: Insert the probe and move the switch on the probe handle to the corresponding gear
5: Make sure the battery is powered or the DC voltage is voltage output
6: Connect the probe clip to the negative battery or the negative DC electrode, and the probe to the battery or DC positive pole
7: Press [auto] once, the DC electrical signal will be displayed. Then, look at the parameter of average value. Note that battery voltage or other DC voltage belong to DC signal, and there is no curve waveform, only a line with up and down offset, and the peak value and frequency of this signal are 0
Crystal vibration measurement
Gear selection: crystal oscillator is easy to stop oscillation after encountering capacitance. Input capacitance of 1x probe is up to 100-300pf, 10x gear is about 10-30pf, and it is easy to stop vibration in 1 x gear, so it is necessary to set 10x gear, that is, both probe and oscilloscope should be switched to 10x gear (probe and oscilloscope are set to 10x gear)
1: Firstly, the oscilloscope is set to auto trigger mode (auto trigger mode is default after startup), and auto trigger mode is used to test the periodic signal (the sine signal of crystal resonance belongs to the periodic signal)
2: The oscilloscope probe multiplier is set to 10x (default is in the 1x gear after startup)
3: Oscilloscope coupling mode is set to AC coupling mode
4: Insert the probe and move the switch on the probe handle to 10x
5: Make sure the crystal board is powered on and running
6: Connect the probe clip to the ground wire of the crystal oscillator board (negative pole of power supply), pull the probe cap out, and inside it is the needle tip, which contacts one of the pins of the crystal oscillator
7: Press the [auto] button once to display the waveform of the crystal vibration tested. If the waveform after automatic adjustment is too small or too large, the waveform size can be adjusted manually by knob
PWM signal measurement of MOS tube or IGBT
Gear selection: the PWM signal voltage of direct drive MOS tube or IGBT is generally within 10v-20v, the control signal of PWM front stage is also generally within 3-20v, and the maximum test of 40V in the 1x gear is enough. Therefore, it is enough to test the PWM signal with the 1x gear (both probe and oscilloscope are set to the 1x gear).
1: Firstly, the oscilloscope is set to auto trigger mode (auto trigger mode is default after startup), and auto trigger mode is used to test cycle signal (PWM belongs to cycle signal)
2: The oscilloscope probe multiplier is set to the 1x gear (default is 1x gear after startup)
3: Oscilloscope coupling mode is set to DC coupling mode
4: Insert the probe and move the switch on the probe handle to the 1x position
5: Make sure that the PWM main board has PWM signal output at this time
6: Clip the probe to the S-pole of the MOS tube and the probe to the g-pole of the MOS tube
7: Press the [auto] button once to display the measured PWM waveform. If the waveform after automatic adjustment is too small or too large, the waveform size can be adjusted manually by knob
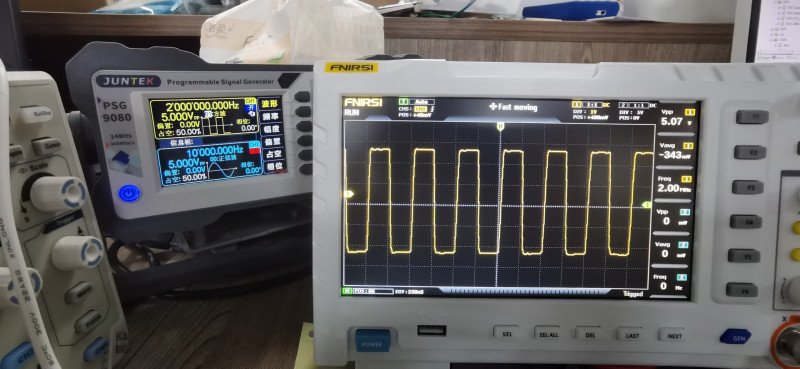
Signal generator output measurement
Gear selection: the output voltage of signal generator is within 30V, and the maximum test value of 1x gear is 40V, so the output of test signal generator is in the 1x gear (probe and oscilloscope are set to be 1x gear).
1: Firstly, the oscilloscope is set to auto trigger mode (the default mode is auto trigger mode after startup), and auto trigger mode is used to test the periodic signal (the signal output by the signal generator belongs to the periodic signal)
2: The oscilloscope probe multiplier is set to the 1x gear (default is 1x gear after startup)
3: Oscilloscope coupling mode is set to DC coupling mode
4: Insert the probe and move the switch on the probe handle to the 1x position
5: Make sure the signal generator is on and is outputting the signal
6: Connect the probe clip to the black clip of the signal generator output line, and the probe to the red output line of the signal generator
7: Press the [auto] button once, the waveform output by the generator will be displayed. If the waveform after automatic adjustment is too small or too large, the waveform size can be adjusted manually by knob
Measurement of domestic electricity at 220V or 110V
Gear selection: first, you need to buy 100x probe; household electric power generally 180-260V, peak peak voltage is 507-733v, the maximum measurement of 1x is 40V, the highest value of 10x is 400V, 10Ox is 4000V, and the default standard probe is 10x high voltage probe, and the peak value of 400V can only be measured. Therefore, 100x probe shall be provided by itself, and then set to 100x gear, that is, both probe and oscilloscope shall be switched to 100x gear
1: Firstly, the oscilloscope is set to auto trigger mode (auto trigger mode is default after startup), and auto trigger mode is used to test the cycle signal (50Hz of household electric power belongs to the periodic signal)
2: The oscilloscope probe multiplier is set to 100x (default is in the 1x gear after startup)
3: Oscilloscope coupling mode is set to AC coupling mode
4: Insert the probe and move the switch on the probe handle to 100X
5: Ensure that the tested end has a home power output
6: Connect the probe clip and probe to 2 wires of household electric power without distinguishing the positive and negative poles
7: Press the [auto] button once to display the waveform of the household electric power. If the waveform after automatic adjustment is too small or too large, the waveform size can be adjusted manually by the knob
Power ripple measurement
Gear selection: if the output voltage of power supply is below 40V, it is set to the 1x gear (both probe and oscilloscope are set to 1x gear), and 10x gear (both probe and oscilloscope are set to the same gear if they are 40-400v)
1: Firstly, the oscilloscope is set to auto trigger mode (auto trigger mode is default after startup), and auto trigger mode is used to test the cycle signal (DC voltage belongs to the periodic signal)
2: The oscilloscope probe multiplier is set to the corresponding gear (default is 1x after startup)
3: The oscilloscope coupling mode is set to AC coupling mode, note that AC AC coupling mode
4: Insert the probe and move the switch on the probe handle to the corresponding gear
5: Make sure the power is powered on and voltage output is available
6: Connect the probe clip to the negative extreme of the power output, and the probe is connected to the positive extreme of the power output, and wait for about 3 seconds. When the yellow line and the left yellow arrow position are in the same position, wait until the position is in the same position
7: Press the [auto] button once, and the power ripple will be displayed
Inverter output measurement
Gear selection: the output voltage of inverter is similar to that of household electricity, with peak peak voltage above 500V, the highest measurement of 40V in 1X, 400V in 10x and 4000V in 100x gear. The default standard probe is 10x high voltage probe, and the peak value of 400V can only be measured at the highest Therefore, 100x probe shall be provided by itself, and then set to 100x gear, that is, both probe and oscilloscope shall be switched to 100x gear
1 : Firstly, the oscilloscope is set to auto trigger mode (the default mode is auto trigger mode after startup), and auto trigger mode is used to test the periodic signal (the signal output by the inverter belongs to the periodic signal)
2: The oscilloscope probe multiplier is set to 100x (default is in the 1x gear after startup)
3: Oscilloscope coupling mode is set to DC coupling mode
4: Insert the probe and move the switch on the probe handle to 100X
5: Ensure inverter is powered on and voltage output is available
6: Connect the probe clamp and probe to the output end of the inverter without distinguishing the positive and negative poles
7: Press the [auto] button once to display the waveform of the inverter. If the waveform after automatic adjustment is too small or too large, the waveform size can be adjusted manually by knob
Measurement of power amplifier or audio signal
Gear selection: the output voltage of power amplifier is generally below 40V, and the maximum test of 40V in the 1x gear is enough (both probe and oscilloscope are set to the 1x gear).
1: First, set the oscilloscope to auto trigger mode (the default is auto trigger mode after startup)
2: The oscilloscope probe multiplier is set to the 1x gear (default is 1x gear after startup)
3: Oscilloscope coupling mode is set to AC coupling mode
4: Insert the probe and move the switch on the probe handle to the 1x position
5: Ensure that the amplifier is on and is outputting audio signals
6: Connect the probe clip and probe to the output end of 2 lines of the amplifier without distinguishing the positive and negative poles
7: Press the [auto] button once to display the waveform of the inverter. If the waveform after automatic adjustment is too small or too large, the waveform size can be adjusted manually by knob
Measurement of vehicle communication signal / bus signal
Gear selection: the communication signal of automobile is generally lower than 20V, and the maximum test for 1x gear is 40V, so it is enough to test the vehicle communication signal signal with the 1x gear (both probe and oscilloscope are set to the 1x gear).
1: Firstly, the oscilloscope is set to normal normal trigger mode (auto trigger mode is default after startup). Normal trigger mode is specially used to measure the non periodic digital signal. If Auto trigger mode is used, it is impossible to grasp the non periodic signal
2: The oscilloscope probe multiplier is set to the 1x gear (default is 1x after startup)
3: Oscilloscope coupling mode is set to AC coupling mode
4: Insert the probe and move the switch on the probe handle to the 1x position
5: Connect the probe clip and probe to two signal lines of communication line, regardless of positive and negative. If there are multiple signal lines, you need to judge the signal line in advance, or try to select two of them for testing several times 6: Make sure that there is a communication signal on the communication line at this time
7: Adjust the vertical sensitivity to 50mV
8: Time base to 20us
9: Press [50%] once
10: When there is communication signal on the communication line, the oscilloscope will capture and display it on the screen. If it can not be captured, it is necessary to try to adjust the time base (1 ms-100ns) and trigger voltage (green arrow) for multiple times
Infrared remote receiver measurement
Gear selection: the infrared remote control signal is generally 3-5v, and the maximum test for 1x gear is 40V, so it is enough to test the vehicle communication signal signal with the 1x gear (both the probe and oscilloscope are set to the 1x gear).
1: Firstly, the oscilloscope is set to normal normal trigger mode (auto trigger mode is default after startup). Normal trigger mode is specially used to measure the non periodic digital signal. If the auto trigger mode is not able to grasp the non periodic signal, the infrared remote control signal belongs to the non periodic digital coding signal
2: The oscilloscope probe multiplier is set to the 1x gear (default is 1x after startup)
3: Oscilloscope coupling mode is set to DC coupling mode
4: Insert the probe and move the switch on the probe handle to the 1x position
5: Connect the probe clip to the ground end (negative) of the infrared receiver board, and the probe to the data pin of the infrared receiver
6: Adjust the vertical sensitivity to 500mv
7: Time base to 20us
8: Turn the trigger red arrow position to the left yellow arrow position and approximately 1 large grid distance
9: At this time, the infrared receive hair signal is sent by remote control, and the waveform will appear on the oscilloscope
Measurement of amplification circuit with sensors (temperature, humidity, pressure, hall, etc.)
Gear selection: generally, the sensor signal is relatively weak, about a few millivolts. This small signal cannot be detected directly by oscilloscope. There is signal amplification part on the main board of this sensor. When the output end of the amplifier is found, the oscilloscope can measure the signal after being enlarged. It can be used in the 1x gear (both probe and oscilloscope are set to the 1x gear)
1: First, set the oscilloscope to auto trigger mode (the default is auto trigger mode after startup)
2: The oscilloscope probe multiplier is set to the 1x gear (default is 1x after startup)
3: Oscilloscope coupling mode is set to DC coupling mode
4: Insert the probe and move the switch on the probe handle to the 1x position
5: Connect the probe clip to the ground end of the sensor motherboard (negative power supply), find the output end of the amplification part, and connect the probe to the output end
6: Adjust the vertical sensitivity to 50mV
7: Adjust the time base to 500ms and enter the slow scan mode of large time base
8: Move baseline to bottom
9: If the signal line appears at the top, the vertical sensitivity shall be reduced, which is 100mV, 200mV, 500mv, etc. in turn, when the updated signal on the right starts not at the top (generally the best in the middle of the upper and lower part), the signal received by the sensor can be detected
В марте купил ослик Fnirsi 1014D, для дома, для семьи. Доставили его быстро, рабочим, не побитым. Ну купил и поставил, особо-то он и не нужен был, так, с Ардуинками поиграться, шим-контроллеры проверять, без претензий, короче. Первым делом заметил, что не определяется компьютером, втыкаешь шланг, он начинает туда-сюда подключаться и отключаться от компа. Но комп был старенький, винда семёрка, да и собственно скрины эти смотреть мне не особо интересно было. Пользовался им крайне мало, за полгода включал от силы раз 10-15-20. И вот где-то летом ещё заметил, что он сам отключается. Включил, а он отключился. Ну снова включил, работает. И вот так раз за разом начал он это делать всё чаще, и очень быстро начал отключаться практически сразу после включения, а под конец не стал после такого отключения включаться обратно, пока не переткнёшь питание.
Пошёл на али, там уже ни спор открыть, ни отзыв написать. Настрочил продавцу, он ответил и на али и в ватсапе.
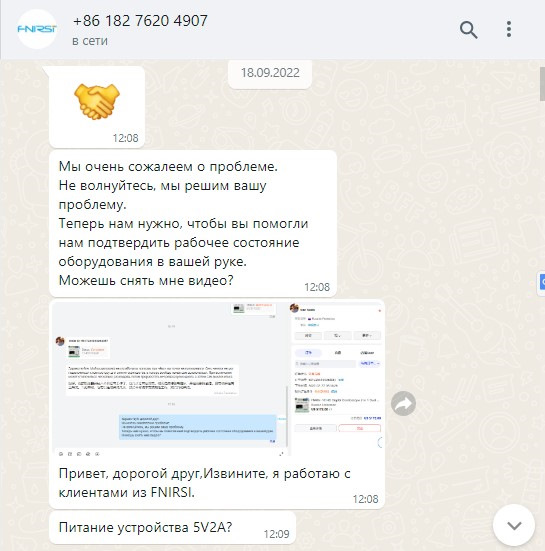
И понеслась вялая переписка. Дай нам видео, запиши видео ещё раз, поменяй блок питания, поменяй карту SD. Пишу ему, мол, пардон, карты никакой нет, не использую. На что тот отвечает:
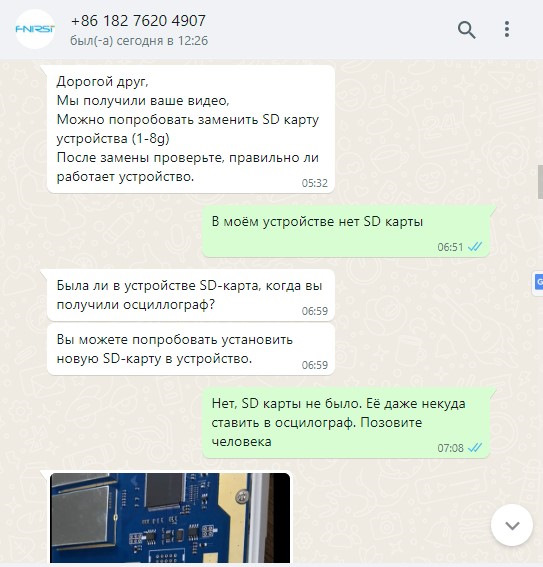
Прикрепил фото, где карта находится внутри ослика. Понимаю, что это бред, менять карту, но что поделать. Взял карточку новую, вскрыл осциллограф, поменял хорошую карту на новую. Ничего это, понятное дело, не принесло, как отключался так и отключается.
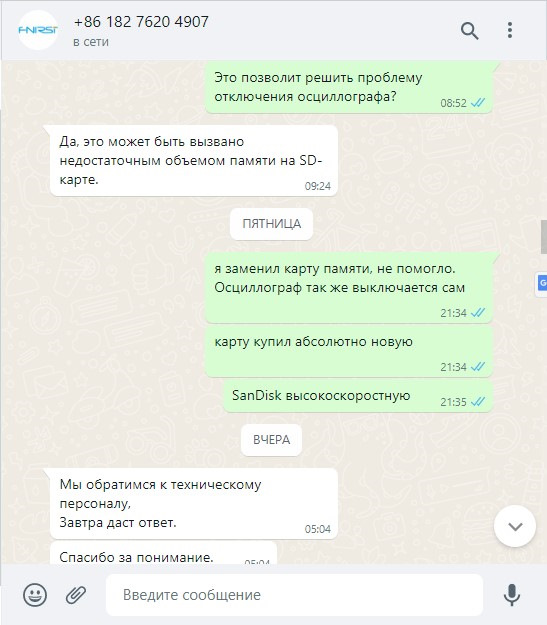
Упражнения с картой ничего не дали, надо, говорит, менять питание.
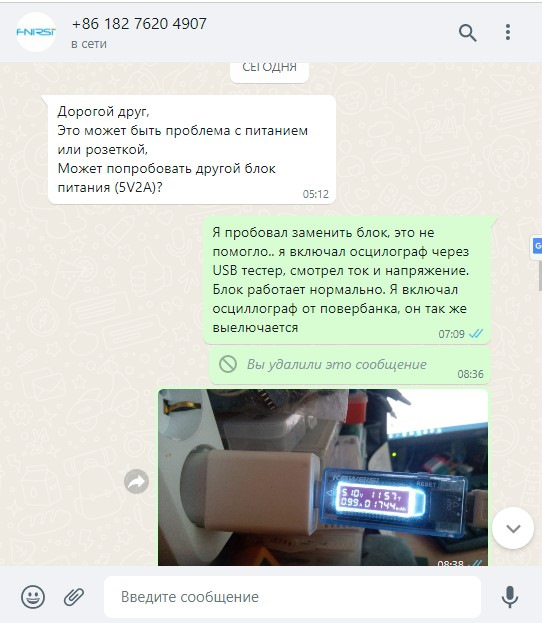
Тоже не помогло. Ну и дальше диалог замкнулся, снова начинает про замену карты, про плохое питание и так по кругу.
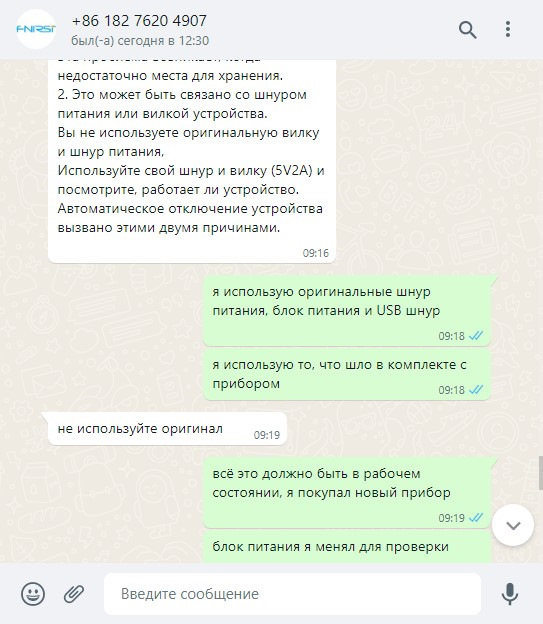
Периодически проскакивают перлы, что мне надо не использовать оригинальные части осцилла, а надо изыскать где-то какие-то другие.
Написал в ВК в группу FNIRSI, но там одна реклама и никаких отзывов, премодерация. Тоже тухляк, короче.
Таким образом, покупкой подтвердил старую истину: «дорого да мило, дёшево да гнило», и ещё «не гонялся бы ты поп, за дешевизной».
Вот такой мой отзыв про FNIRSI 1014D, само FNIRSI и Алиэкспресс.